Datavizta : Educational tool to visualize manufacturers impact data
Boavizta aims at mainstreaming the assessment and reduction of the environmental impacts of Information and Communication Technologies (ICT) in organizations by continuously improving its quality. To fullfill this objective, we created a working group, Boavizta, to deliver open-source tools, methods and open data.
One of Boavizta’s first projects was to identify and centralize all impact data published by manufacturers. These data, which, exclusively concern global warming potential impacts (GHG emissions in kgCO2eq), are centralized and regularly updated on the Boavizta Github repository.
Objectives
Today, the CSV file containing all the data is used by many organizations, but it cannot be used without users downloading it and opening it with a spreadsheet tool. Moreover, users must download the file regularly to get the updates.
The first objective of the Datavizta tool is therefore to remove these limitations by publishing this data in a way that can be used much more easily directly from a browser.
The second objective is to offer an educational tool allowing users to easily manipulate the data to visualize :
- the distribution of impact between the manufacturing and use phases of the device
- how the impact evolves according to the country in which the device is used
- how the impact evolves when the life span of a device is extended or reduced
- the impacts of a specific device or those of a category of devices (Smartphone, Laptop, Desktop, Server, Monitor…)
Presentation of the tool
Boavizta’s Datavizta tool is available at the following URL: https://dataviz.boavizta.org
It is divided into 2 main sections :
- The upper part displays a table allowing to visualize the data and to apply filters on each of the columns in order to select the data that interest us,
- The lower part is itself divided into 3 sections:
- A section displaying the impact information in the form of a pie chart to visualize the distribution of the impact between scope 2 (use phase) and scope 3 (manufacturing, transport and end-of-life phases),
- A section allowing to adjust the variables of country of use of the material and life cycle,
- A section allowing to generate exports in the form of images or links.
Raw data visualization table
This table includes all the entries in the Boavizta database, but only displays the columns that seemed relevant to us, since the impact data is displayed in the section dedicated to this purpose.
![Raw data visualization table]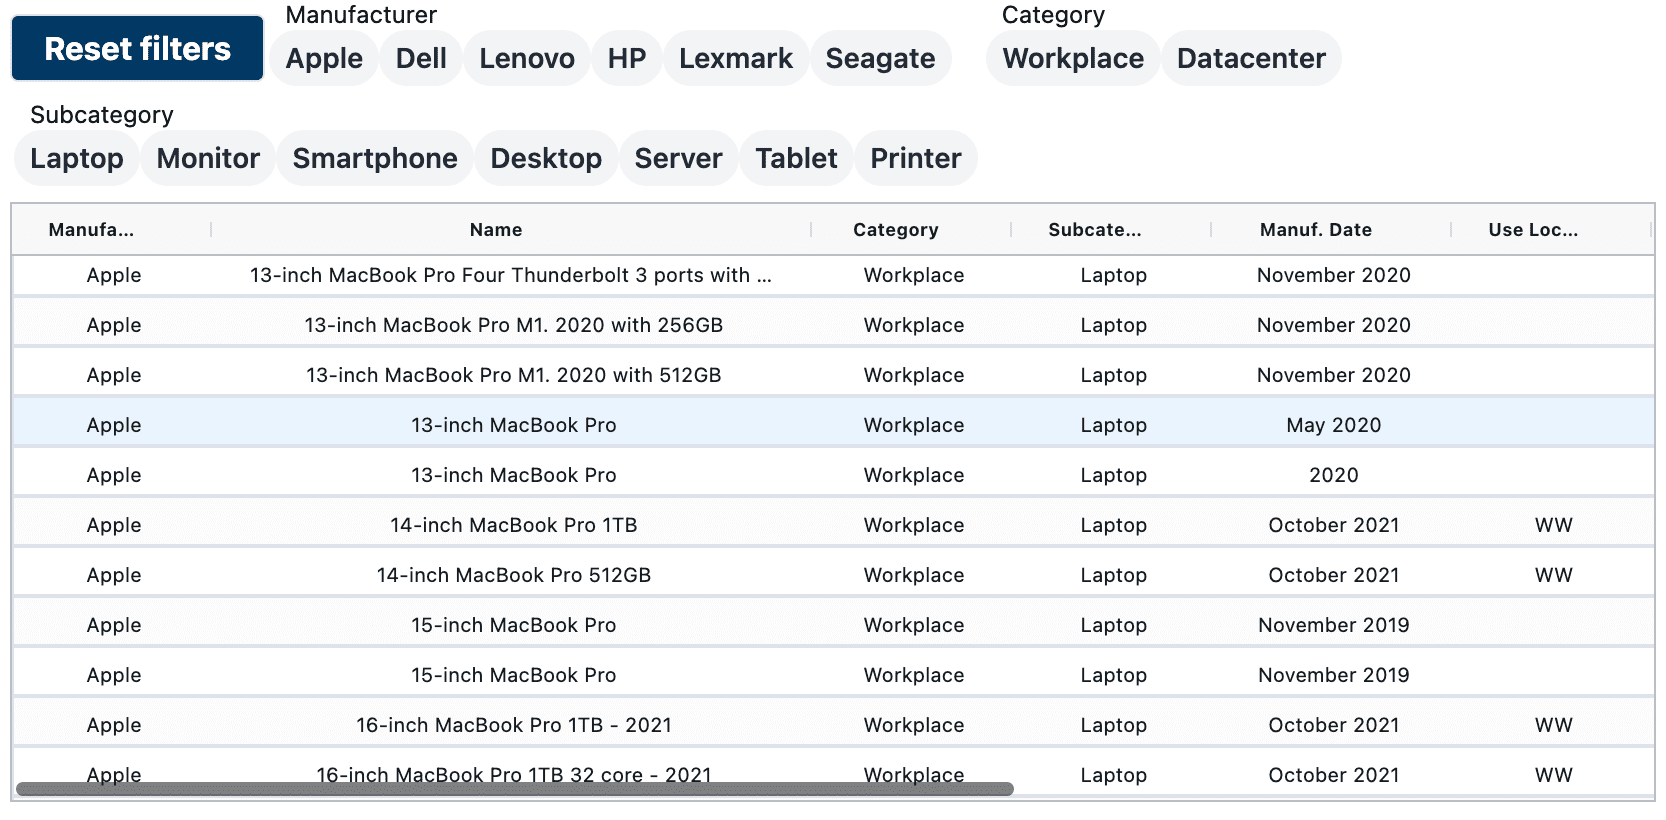
You can filter the displayed rows by clicking on the right part of the column header. This displays a search window allowing you to configure your filter with many options similar to those of a spreadsheet.
You can also simply select the equipment of your choice by clicking on the associated line. Be careful, however, not to double-click on the line and then deselect it immediately to return you to the previous selection.
To simplify the application of filters, the buttons above the table allow you to apply a combination of filters by manufacturer, category and subcategory.
Once the filters are applied or an item is selected, the impact data displayed in the lower part of the table is updated taking into account only the selected data.
Results on Pie Chart
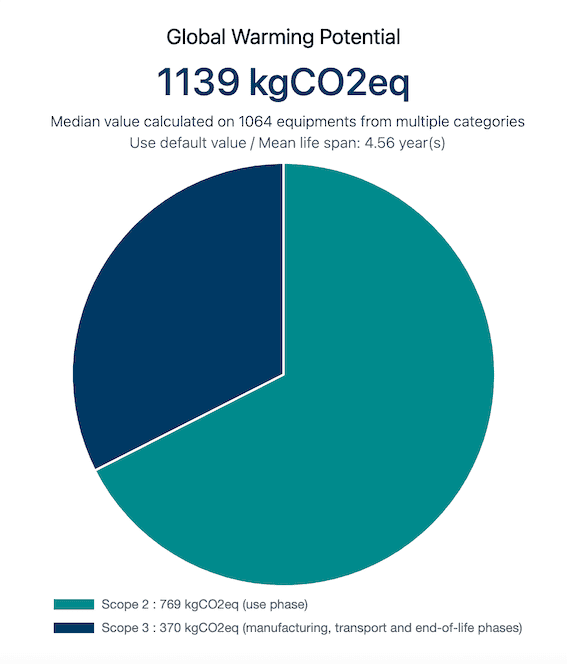
This pie chart displays :
- the overall average carbon impact of the selected equipment,
- the name of the selected equipment or the category of the selected equipment, if applicable,
- the breakdown of the impact between scope 2 (use phase) and scope 3 (manufacturing, transport and end-of-life phases),
- details of the values for each scope.
Customization form
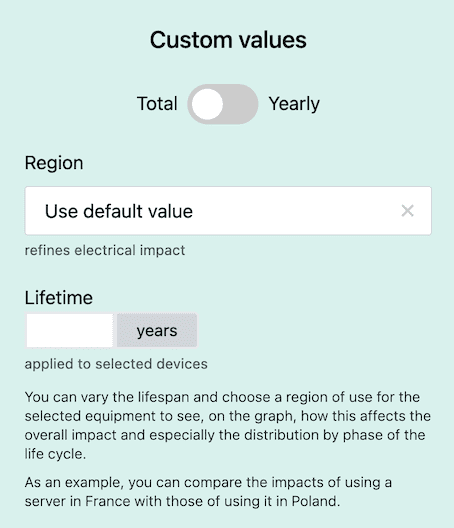
One of the main interests of the Datavizta tool is to be able to vary certain variables such as the lifespan of equipment and the place of use.
This feature, which is intended to be educational, makes it very easy to compare the impact of equipment used in two countries with very different electricity mixes (e.g. comparison of China with France) and to see that extending the life of equipment is extremely beneficial, especially in countries where the electricity is low in carbon.
It should be noted that the data provided by the manufacturers unfortunately does not allow us to adjust the variables for all the equipment in the database. For the equipment that do not allow to do so, the form allowing to modify the variables will be grayed out and you will not be able to enter any information.
With the button at the top of the customization area, you can display the results as an annual impact rather than over the life span of the devices.
Export features
A section regrouping export features is located on the right (on tablet and PC) or above (on smartphone) the pie chart displaying the results.

Export data to CSV format
The “Export to CSV” button allows you to generate a CSV file containing all the data of the Boavizta database for the selected equipments resulting the application of the filters.
Export results as an image
The “Export to PNG” button allows you to generate an image of the results in PNG format. Once the image has been generated, it is necessary to click on the “Download” button to save the image.
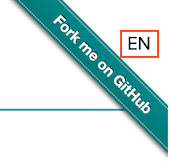
Change language
By default, the page is displayed in the language of your browser (French or English) but you can easily translate the page from French to English by using the button at the top right of the page.
Limits of manufacturers’ data
We draw the attention of the users of the Datavizta tool and more generally of the data present in the Boavizta database that these data are exclusively issued from the PCF (Product Carbon Footprint) sheets provided by manufacturers. As methodologies used are not transparent and very often have very large margins of error, we do not recommend using these data to make precise impact measurements or to compare the impacts of equipment from different manufacturers. The purpose of making these data available is mainly to give ideas of orders of magnitude and to compare different models from the same manufacturer.
In addition, most manufacturers rely on the [PAIA evaluation method] (https://msl.mit.edu/projects/paia/main.html) developed by MIT. This method is based on data from non-public studies and Boavizta was not able to evaluate its relevance.
If you want to contribute, please contact Boavizta or do it directly on GitHub.
A big thank you to the people who contributed to the development of this tool, especially during the last two hackathons organized by Boavizta:
- Bruno Thomas
- David Ekchajzer
- Gregory Pelletier
- Olivier Delcroix
- Romain Lorenzini
- Youen Chéné